A Simple Data Engineering Project That Actually Shows How It Works
Most explanations of data engineering fail at the same point.
They explain tools before behavior.
You hear words like pipeline, ETL, warehouse, orchestration. But you never see how raw, messy data slowly becomes something reliable. So today we build a small system. Not impressive. Not scalable. But real.
This is how data engineering works in practice.
The Problem We Are Solving
Imagine a very small product team.
Users sign up on a website. Every signup generates a raw event. The business wants a daily report showing how many users signed up from each source.
That sounds simple.
But raw data is not friendly. It arrives incomplete. Sometimes fields are missing. Sometimes formats change. Sometimes data lies.
Our job is to take raw events and turn them into something trustworthy.
Access the Part 1 article here: Data Engineering
Step 1: Raw Data As It Really Looks
Here is how raw signup data often arrives. A CSV file dropped every day.
user_id,signup_time,source
101,2026-01-10 09:12:33,google
102,2026-01-10 09:45:10,
103,2026-01-10 10:01:54,facebook
104,,twitter
105,2026-01-10 11:20:00,google
This is not clean.
One row has a missing source. One row has a missing timestamp.
Analytics tools will happily read this. That does not mean they should.
Step 2: The First Data Engineering Decision
Before writing code, a data engineer makes decisions.
- If signup_time is missing, drop the record
- If source is missing, label it as unknown
- Enforce a standard timestamp format
- Never silently accept broken rows
These rules matter more than libraries.
Step 3: Writing the Ingestion Logic
Now we write a small Python script. Nothing fancy.
import csv
from datetime import datetime
clean_rows = []
with open("raw_signups.csv", "r") as file:
    reader = csv.DictReader(file)
for row in reader:
        if not row["signup_time"]:
            continue
        try:
                    signup_time = datetime.strptime(
                        row["signup_time"], "%Y-%m-%d %H:%M:%S"
                    )
                except ValueError:
                    continue
        source = row["source"] if row["source"] else "unknown"
        clean_rows.append({
                    "user_id": row["user_id"],
                    "signup_date": signup_time.date(),
                    "source": source
                })
This is data engineering.
Not dashboards. Not ML. Just protecting truth at the boundary.
Step 4: Storing Clean Data
Now we store the cleaned output. In real systems this would be a warehouse. Here we use another CSV.
with open("clean_signups.csv", "w", newline="") as file: fieldnames = ["user_id", "signup_date", "source"] writer = csv.DictWriter(file, fieldnames=fieldnames)
writer.writeheader()
writer.writerows(clean_rows)
Why separate raw and clean data?
Because raw data is evidence. Clean data is interpretation.
Good data systems never destroy evidence.
Step 5: Transforming Data For Analytics
Now the business question.
How many users signed up per source per day?
This is a transformation layer.
from collections import defaultdict
daily_counts = defaultdict(int)
for row in clean_rows:
    key = (row["signup_date"], row["source"])
    daily_counts[key] += 1
This logic is boring. That is good.
Data engineering should be boring when done right.
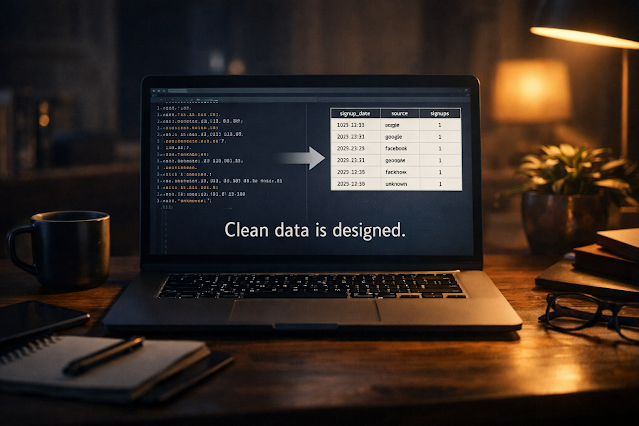
Step 6: Producing Analytics Output
Finally we write a report.
with open("daily_signup_report.csv", "w", newline="") as file:
    writer = csv.writer(file)
    writer.writerow(["signup_date", "source", "signups"])
    for (date, source), count in daily_counts.items():
          writer.writerow([date, source, count])
The output now looks like something decision makers can trust.
signup_date,source,signups
2026-01-10,google,2
2026-01-10,facebook,1
2026-01-10,unknown,1
What We Actually Built
This small script contains every core data engineering idea.
- Raw data ingestion
- Data validation
- Business rules
- Separation of raw and clean layers
- Transformation logic
- Analytics ready output
No Spark. No Airflow. No cloud.
Just correctness.
Why This Matters More Than Tools
Tools scale this pattern.
Spark replaces loops. Warehouses replace CSVs. Schedulers automate execution.
But the thinking stays the same.
Most broken data systems fail because this thinking never happened.
The Real Job Of A Data Engineer
It is not moving data faster.
It is deciding what truth means and enforcing it consistently.
That is why data engineering sits between chaos and clarity.
In the next article, we will take this exact example and show how it breaks when schemas change. And how real teams protect themselves from that.
Stay Ahead of What Comes Next
This series started with a simple question: why data engineering exists in the first place. From there, we moved closer to the work itself, looking at how raw data behaves and how even small pipelines quietly carry assumptions.
Refer Day 1 Article — How Data Engineering is Important
Those assumptions are usually invisible until something feels off.
Most data systems do not fail in obvious ways. They keep running. Numbers keep updating. But meaning slowly drifts as fields change, formats evolve, or context is lost. By the time someone notices, the data has already led decisions in the wrong direction.
The next part of this series will focus on noticing those shifts earlier. We will look at practical signals that indicate data is changing, simple checks that help catch problems sooner, and lightweight ways to protect downstream users without slowing teams down.
This was Day 2 of the MayhemCode 30-day Data Engineering series.
Reliable data is built by paying attention early, not by fixing things later.
That is where the work continues.